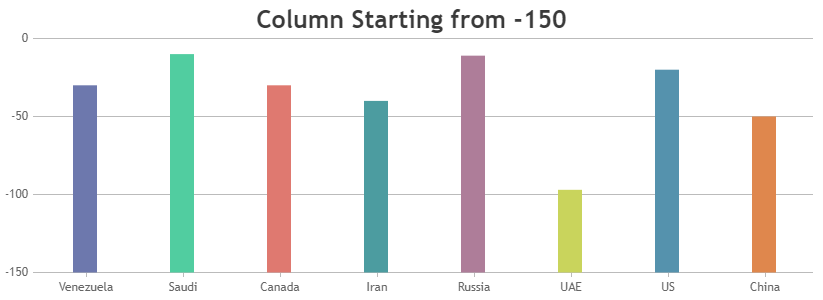
I’m currently facing an issue where the Y Axis values in my bar chart range from 0 to -150. However, I specifically want the bars to start from -150 and only extend upward to the specified values, rather than starting from 0. Is there a property similar to beginAtZero that I can utilize to make the bars expand from -150 on the Y Axis?
const options = {
animationEnabled: true,
dataPointWidth: 10,
theme: “light2”, // “light1”, “light2”, “dark1”, “dark2”
title: {
text: “”
},
axisX: {
minimum: 2560,
maximum: 2630,
gridThickness: 1,
labelAngle: -50,
intervalType: “number”,
tickLength: 10,
tickPlacement: “outside”,
tickThickness: 1,
interval: 10,
},
axisY: {
title: “”,
reversed: true,
minimum: -150,
maximum: 0,
intervalType: “number”,
},
data: [{
type: “column”,
// indexLabelOrientation: “vertical”,
// axisYIndex: 10,
indexLabel: “{y}”,
indexLabelPlacement: “outside”,
indexLabelFontColor: “black”,
legendMarkerColor: “grey”,
dataPoints: sortedData,
color: ‘#348ceb’,
indexLabelOrientation: “vertical”,
}]
};
-
This reply was modified 2 years, 8 months ago by
 ajit.
ajit.
.