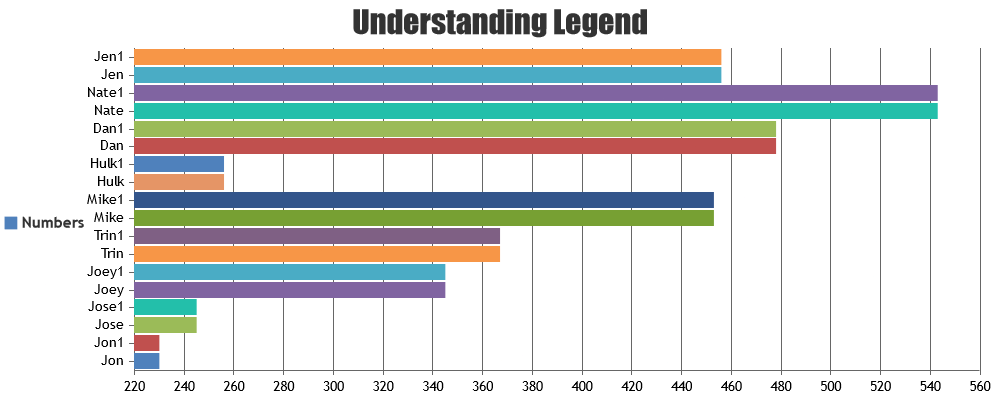
I am trying to add label in bar chart, but it is showing label (on y-axis) only alternate bar. We want it to be visible for each bar. Please suggest.
Code – https://jsfiddle.net/8tdwgb1L/
  window.onload = function () {
    var chart = new CanvasJS.Chart("chartContainer",
    {
      title:{
        text: "Understanding Legend"
      },

      legend: {
       horizontalAlign: "left", // "center" , "right"
       verticalAlign: "center",  // "top" , "bottom"
       fontSize: 15
     },
     data: [
     {
      type: "bar",
      showInLegend: true,
      legendText: "Numbers",
      dataPoints: [
      {label: "Jon", y: 230 },
      {label: "Jon1", y: 230 },
      {label: "Jose", y: 245},
      {label: "Jose1", y: 245},
      {label: "Joey", y: 345},
      {label: "Joey1", y: 345},
      {label: "Trin", y: 367 },
      {label: "Trin1", y: 367 },
      {label: "Mike", y: 453 },
      {label: "Mike1", y: 453 },
      {label: "Hulk", y: 256 },
      {label: "Hulk1", y: 256 },
      {label: "Dan", y: 478},
      {label: "Dan1", y: 478},
      {label: "Nate", y: 543 },
      {label: "Nate1", y: 543 },
      {label: "Jen", y: 456 },
      {label: "Jen1", y: 456 }
      ]
    }
    ]
  });

    chart.render();
  }
.