Login to Ask a Question or Reply
You must be logged in to post your query.
Home › Forums › Chart Support › Background for area covered by line
Background for area covered by line
- This topic has 5 replies, 2 voices, and was last updated 4 years, 6 months ago by
Ranjitha R.
Tagged: area, background, graph
-
January 26, 2022 at 6:01 pm #36760
Hello,
I am using the free version of Canvas Js for now and planning to get the pro version. However, I couldn’t find a feature where I could add background color to the area covered by certain lines.
I am sharing an image here – https://drive.google.com/file/d/1HCtYEDK_HhOTzt6UfkNTyFuV2jmIUd5i/view?usp=sharingThe lines produced are created by using the ‘line’ type graph and each line is one individual line graph as shown in the code below. I want to apply background color to the area that is covered by the lines where the orange dot is seen.
Can I do that in the pro version?
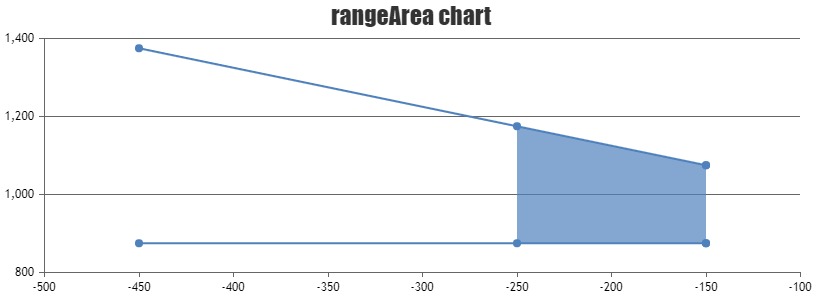
data: [
                {
                	type: "line",
                	lineColor: "green",
                	dataPoints: [
                	  { x: -150, y: 875 },
                	  { x: -150, y: 1075 },
                	]
                },
                {
                	type: "line",
                	lineColor: "green",
                	dataPoints: [
                	  { x: -450, y: 875 },
                	  { x: -150, y: 875 },
                	]
                },
                {
                	type: "line",
                	lineColor: "green",
                	dataPoints: [
                	  { x: -150, y: 1075 },
                	  { x: -450, y: 1375 },
                	]
                },
January 27, 2022 at 8:45 pm #36786You can use range-area chart to fill certain region of the series with a background color. Please find the code-snippet below.
data: [
      {
        type: "rangeArea",
        dataPoints: [
          { x: -150, y: [875,1075]},
          { x: -450, y: [875, 1375]},
          { x: -150, y: [875, 1075]},
          { x: -250, y: [875, 1175]}
        ]
      }]
Also, please take a look at this JSFiddle for working example.
—-
Ranjitha R
Team CanvasJSJanuary 31, 2022 at 2:36 pm #36827Hello @Ranjitha,
Thank you for your insights.I was able to workaround.
However, I am stuck in one of the graphs where there is an area inside another area. The orange and green areas are different. Screenshot – https://prnt.sc/26ma78s
Can we achieve this using the range-area?I would also like to inform you that we are purchasing the pro license this week after completing the graphs.
Thank you for your help.
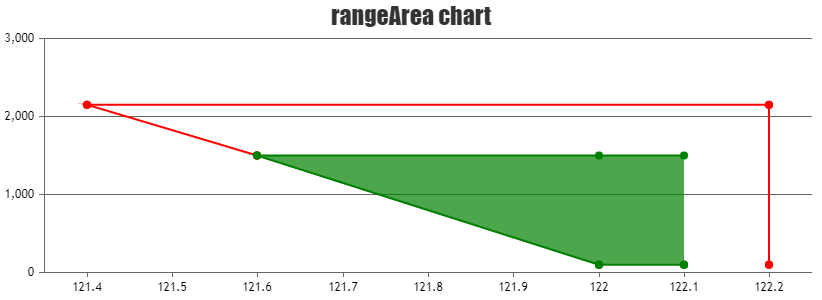
February 1, 2022 at 6:20 pm #36851You can plot more than one dataseries to display the multi-series range-area chart. Please find the code-snippet below.
data: [
  {
    type: "rangeArea",
    color: "red",
    dataPoints: [
      { x: 122.2, y: [100,100]},
      { x: 122.2, y: [2150,2150]},
      { x: 121.4, y: [2150,2150]},
      { x: 121.6, y: [1500,1500]},
    ]
  },
  {
    type: "rangeArea",
    color: "green",
    dataPoints: [
      { x: 122.1, y: [100,1500]},
      { x: 122,   y: [100,1500]},
      { x: 121.6, y: [1500,1500]},
      { x: 122,   y: [100,100]},
      { x: 122.1, y: [100,100]},
    ]
  }]
Also, Please take a look at this JSFiddle for working sample.
—-
Ranjitha R
Team CanvasJSFebruary 2, 2022 at 10:47 am #36856Hello @Ranjitha,
I was able to do it the other around. Anyways, thank you for your reply again.
We have just one last graph remaining and I am struggling to do it. The shape of the graph is quite different as shown here – https://drive.google.com/file/d/1kz4ACnf2BOIWM6eXI6DGZbunCIpUOLee/view?usp=sharing
Can you please provide some hints?
Thank you,
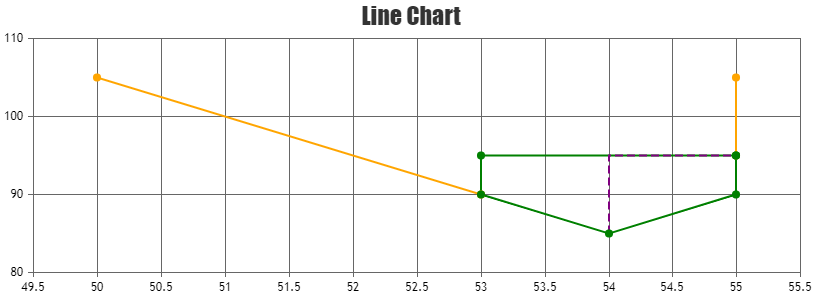
February 2, 2022 at 8:14 pm #36862You can use multi-series line chart to achieve your requirement. You can further customize the dash-type, color of the line using color and lineDashType properties and you can enable grids by setting gridThickness. Please take a look at this JSFiddle for working sample.
—–
Ranjitha R
Team CanvasJS
Tagged: area, background, graph
You must be logged in to reply to this topic.