@nerviozzo96,
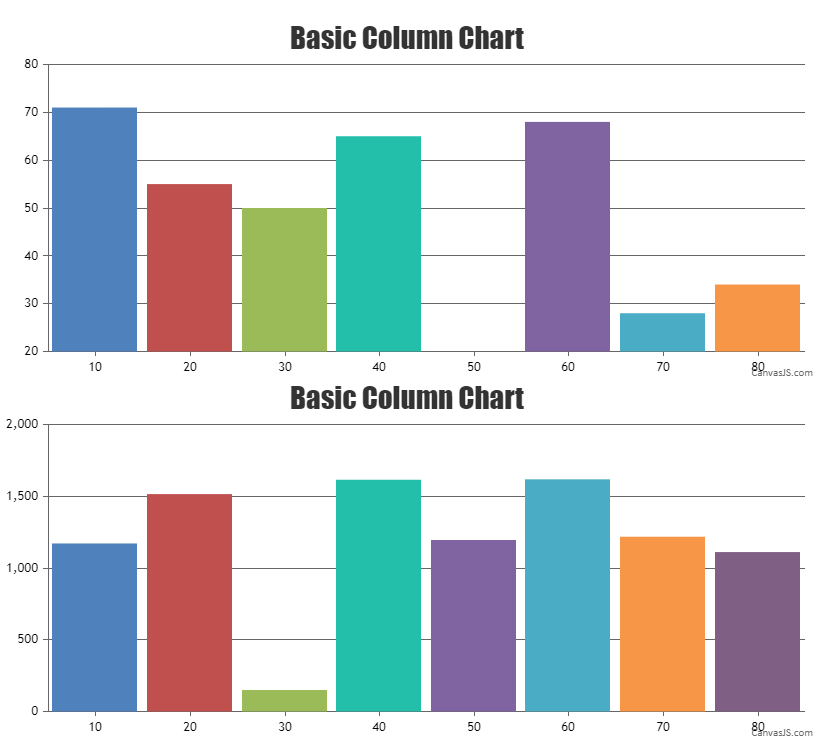
Aligning y-axis for multiple charts can be achieved by setting the margin property. The margin value has to be calculated based on the bounds of y-axis as shown in the code below –
var axisYBoundMax = 0;
for (var i=0; i<charts.length; i++) {
  axisYBoundMax = Math.max(axisYBoundMax, charts[i].axisY[0].bounds.x2);
}

for(var i = 0; i < charts.length; i++) {
  charts[i].axisY[0].set("margin", axisYBoundMax - (charts[i].axisY[0].bounds.x2 - charts[i].axisY[0].bounds.x1));
}
Also, kindly take a look at this updated JSFiddle with the code to align the y-axis for multiple charts.
Considering this thread as duplicate of AxisY and AxisY2 margin/width. Hence closing the same.
—
Adithya Menon
Team CanvasJS
.