Home Forums Report Bugs Axis x Duplicate days.

Axis x Duplicate days.

Viewing 9 posts - 1 through 9 (of 9 total)
  • #5290

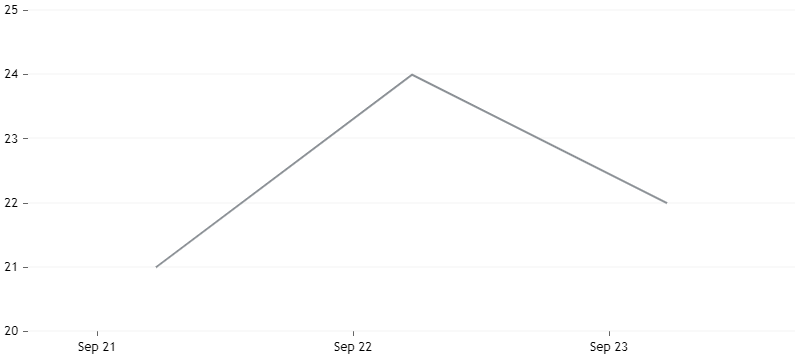
    Hello, i am experiencing a rather weird bug, when my datasets are 3 the days on the x axis are being duplicated multiple times.
    Check the image :

    3 day graph bug

    The code:

    
        	var colors = new Array();
    
        	colors[0] = "#AA5A4B";
        	colors[1] = "#DC5A4B";
        	colors[2] = "#E6918C";
        	colors[3] = "#505050";
        	colors[4] = "#32465F";
        	colors[5] = "#8C9196";
        	colors[6] = "#DCD2C8";
    
        	var line_graph = new CanvasJS.Chart("523ff45f32a214.25570229609267094",
        	{
        		        backgroundColor: "rgba(0,0,0,0)",
            axisX:{
            	intervalType: "day",
            	lineThickness: 0,
            	valueFormatString: "MMM DD"
            },
            axisY:{
            	gridThickness: 0.5,
            	gridColor: "#EAEAEA",
            	lineThickness: 0
            },
            legend:{
            	fontFamily:"Open Sans",
            	verticalAlign: "top",
            	horizontalAlign: "center",
            	fontSize: 13
            },					
            data: [
            {
            	type: "line",
            	color: ""+colors[Math.floor((Math.random()*6))],
            	markerSize: 0,
            	dataPoints: [
            	        	{x: new Date("2013-09-21"), y: 21 },
            	        	{x: new Date("2013-09-22"), y: 24 },
            	        	{x: new Date("2013-09-23"), y: 22 }
    
            	        	]
            },
            ]
        });
        
    line_graph.render();
        	
    • This topic was modified 10 years, 6 months ago by Patsy Issa.
    #5300

    Thanks for reporting.. I’ll have a look into the issue and get back.

    #5312

    I have reproduced the problem in a JSFiddle. Hope this helps.

    #5318

    Thanks for the fiddle. I’ll be looking into this issue tomorrow.

    #5334

    Hello, any updates regarding the issue ?

    #5336

    Patsy,

    I’ve found the issue but haven’t fixed the same yet. You should have a solution by the end of this week.


    Sunil Urs

    #5373

    Patsy,

    On further research, there is no bug in the library actually. I had confused it with something else. In your code I hadn’t observed that you have missed interval property of axis. Unless you set interval property, intervalType is ignored.

    Here is the chart working fine when the interval property is set to 1.

    Setting axisX interval and intervalType in chart


    Sunil

    #5374

    Damn nice catch, completely slipped my mind. Cheers on the awesome support.

    #22433

    set interval:1

Viewing 9 posts - 1 through 9 (of 9 total)

You must be logged in to reply to this topic.