@codypraveen,
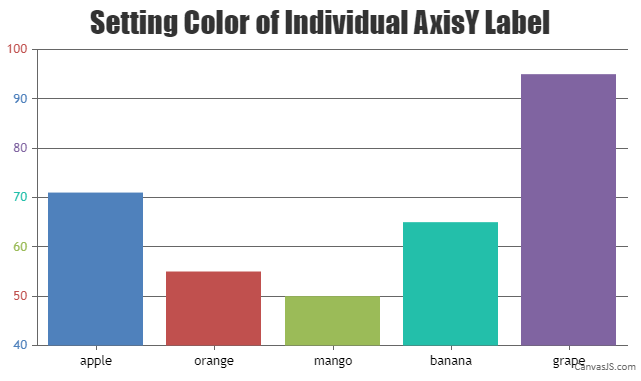
It is not possible to set multiple colors for axis labels or place an image beside labels as of now. However, you can use stripLines to set multiple colors for y-axis labels. To achieve this, you need to first hide all the axisY labels using labelFormatter and store the labels in an object as shown in the code snippet.
axisY: {
  labelFormatter: function(e) {
    if(axisYLabels[e.value] === undefined) {
      axisYLabels[e.value] = e.value;
    }
    return "";
  }
}
After rendering the chart, you can iterate through the labels object stored above and add stripLines for each label value with different labelFontColor using addTo method. Please refer to the code snippet below for the same.
var i = 0;
for(var label in axisYLabels) {
  if (axisYLabels.hasOwnProperty(label)) {
    chart.axisY[0].addTo("stripLines", { value: label, label: label, labelPlacement: "outside", labelBackgroundColor: "white", color: "transparent", labelFontColor: axisLabelColors[i%axisLabelColors.length] });
    i++;
  }
}
Please take a look at this JSFiddle for an example.
—-
Manoj Mohan
Team CanvasJS
.