Home Forums Chart Support Any way to remove the “Y” values from the chart?

Any way to remove the “Y” values from the chart?

Viewing 3 posts - 1 through 3 (of 3 total)
  • #32975

    I have a chart that shows buyer activity over the past 12 months. I do not want to display the actual Y values, as they are not relevant to the end user. The purpose of the graph is simply to show how buyer activity has increased or decreased from month to month. Is there any way to remove the Y values from the Y axis and also the hover box which appears when you roll over a data point? Been digging through the documentation but unable to find a solution. Appreciate any assistance!

    #32977

    Determined I can set toolTip enabled: false to remove the hover box. Also determined I can set axisY labelFontSize: 0 which removes the Y values. Achieved as desired, though still curious if there are more efficient ways to accomplish this.

    #32995

    @mninet,

    If you like to disable interactivity with the chart (i.e. dataPoint highlight, toolTip, touch, and mouse events) you can set interactivityEnabled: false. However, if you want to highlight the dataPoint and just hide the toolTip you can disable it using enabled property as shown in the code below –

    toolTip:{
       enabled: false,
     }

    To hide the y-axis labels and ticks you can return an empty string inside labelFormatter and set tickThickness to 0 as shown below –

    axisY: {
      tickThickness: 0,
        labelFormatter: function(e) { 
          return "";
        }
    },

    Also, kindly take a look at this JSFiddle for an example on hiding toolTip and y-axis labels.
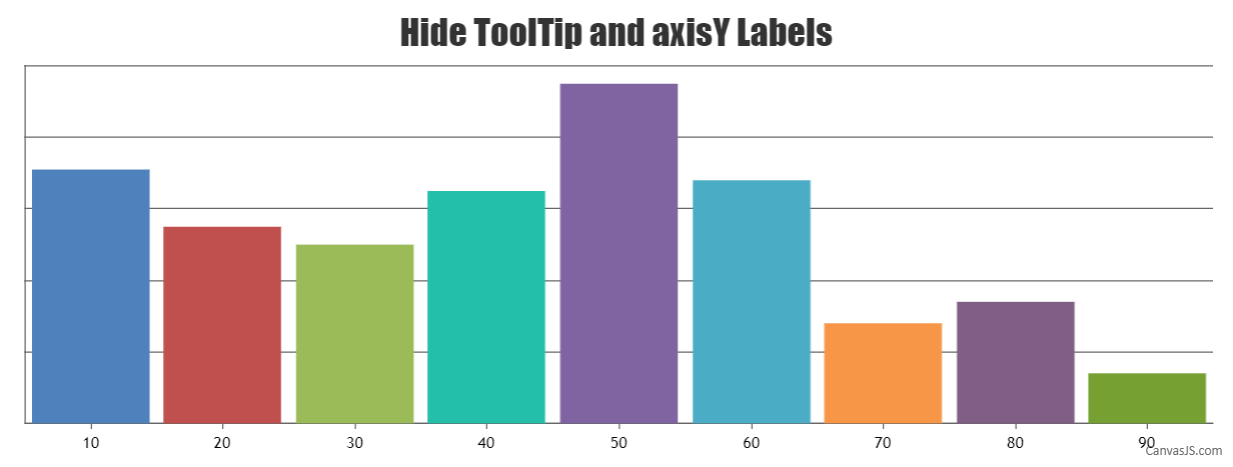
    hide toolTip and axisY labels

    ___________
    Indranil Deo
    Team CanvasJS

Viewing 3 posts - 1 through 3 (of 3 total)

You must be logged in to reply to this topic.