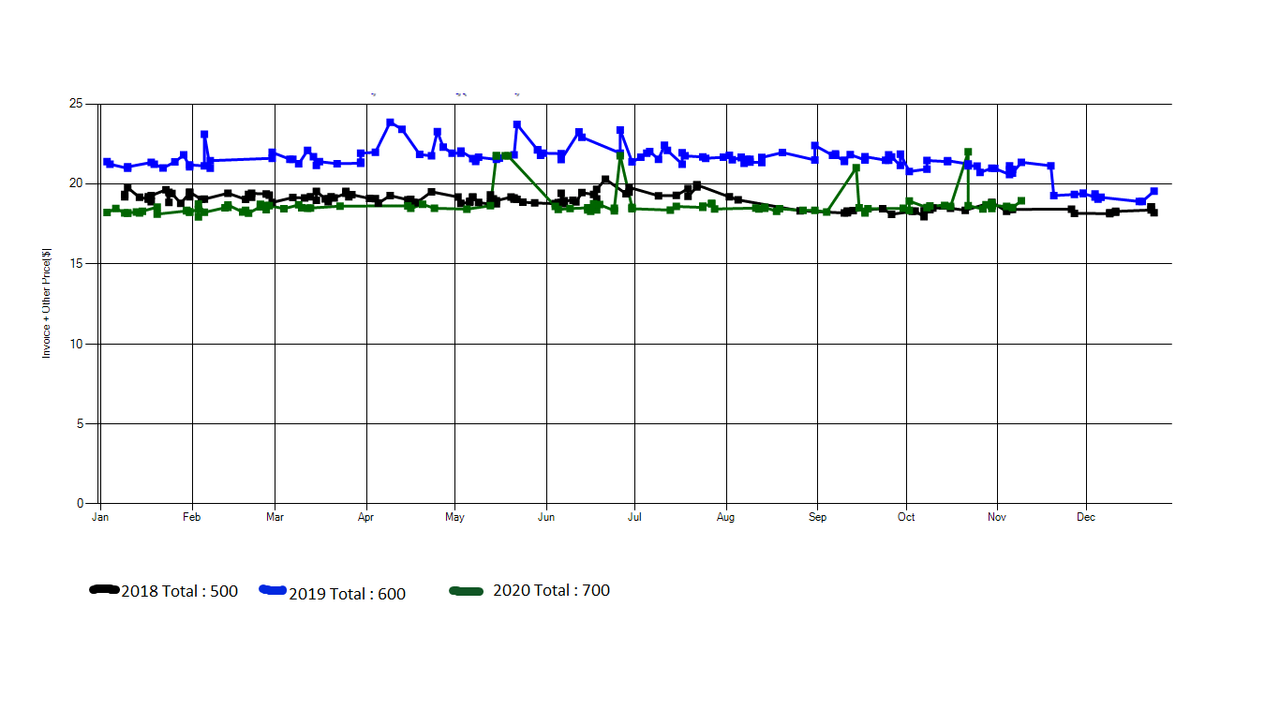
All 30/31 days Monthly Chart for a year
- This topic has 3 replies, 2 voices, and was last updated 5 years, 8 months ago by
.
Viewing 4 posts - 1 through 4 (of 4 total)
Viewing 4 posts - 1 through 4 (of 4 total)
You must be logged in to reply to this topic.