@weijian-zhu2,
With the help of itemouseover and itemmouseout event handler of legend, you can highlight the dataseries of the respective hovered legend. Please take a look at this code-snippet below for the same.
itemmouseover: function(e){
  for(var i=0; i<e.chart.data.length; i++) {

    if(i != e.dataSeriesIndex)
      e.chart.options.data[i].fillOpacity = 0;
  }
  e.chart.render();
},
itemmouseout: function(e){
  for(var i=0; i<e.chart.data.length; i++) {
    if(i != e.dataSeriesIndex)
      e.chart.options.data[i].fillOpacity = null;
  }
  e.chart.render();
}
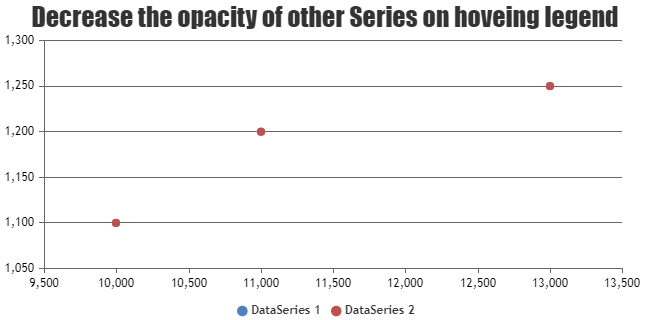
Also, check out this JSFiddle for complete working code.
—-
Manoj Mohan
Team CanvasJS
.