Home Forums Chart Support Add x-padding for the chart

Add x-padding for the chart

Viewing 2 posts - 1 through 2 (of 2 total)
  • #37508

    Hi,

    I have a chart with multiple y-axis. The data points are very large. So the same x-position will have multiple data points.

    If the first and last x-position has multiple points, it’s difficult to view the chart points. It’s almost rendered over the y-axis. Is there any option to add some padding between the y-axis line and the chart points?

    I have sample jsfiddle I want to add some padding between the y-axis line the data points. How can I achieve this? Is there any option in CavasJs to do this?

    #37516

    @ragu1991nathan,

    Based on the minimum x-value among all the data series, you can set the minimum for X-axis to add some space between the Y-axis line and the first datapoint as shown in the code-snippet below,

    function setXMin() {
      var xMinValue = 0;
      for(var i = 0; i < chart.options.data.length; i++) {
        xValues.push(chart.options.data[i].dataPoints[0].x);
      }
      xMinValue = Math.min(...xValues);
      chart.axisX[0].set("minimum", xMinValue - chart.axisX[0].get("interval"))
    }

    Kindly take a look at this updated JSFiddle for an example on the same.

    Please refer to this forum thread for more information & examples.
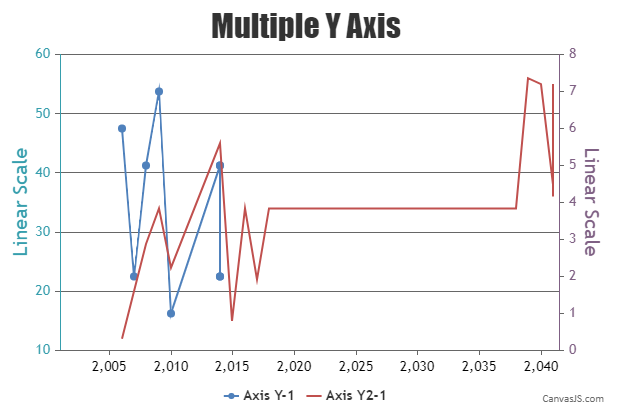
    setting minimum value of X-axis


    Adithya Menon
    Team CanvasJS

Viewing 2 posts - 1 through 2 (of 2 total)

You must be logged in to reply to this topic.