Login to Ask a Question or Reply
Home › Forums › Chart Support › Chart via JSON › Reply To: Chart via JSON
June 29, 2015 at 7:46 pm
#9129
[Update]
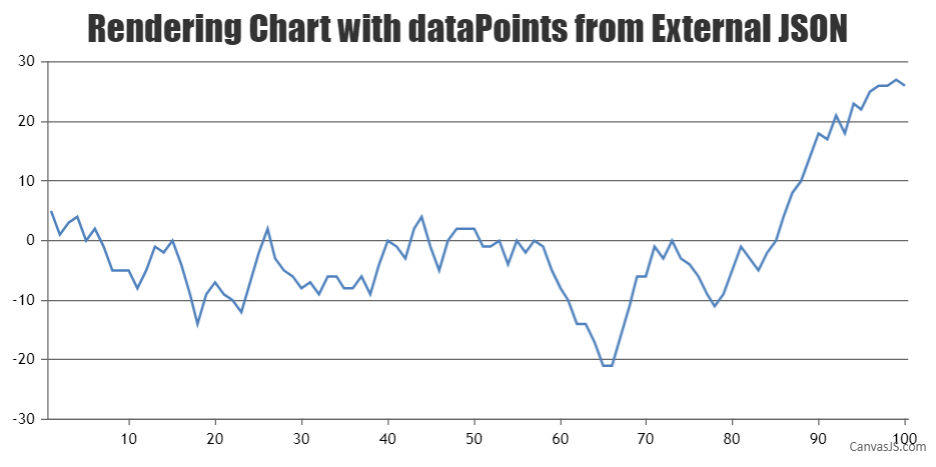
Now we have a Tutorial on Creating Charts from JSON Data in our documentation.
Hello,
You need to create a HTML page that does AJAX request and fetch the data. After getting the data, it will render a Chart. Please refer the below mentioned code :
<html>
<head>
    <script type="text/javascript" src="https://canvasjs.com/assets/script/jquery-1.11.1.min.js"></script>
    <script type="text/javascript" src="https://cdn.canvasjs.com/canvasjs.min.js"></script>
    <script type="text/javascript">
        $(document).ready(function () {

            var dataPoints = [];

            var chart = new CanvasJS.Chart("chartContainer",
            {
                    title: {
                        text: "Basic Column Chart"
                    },
                    data: [
                    {
                        dataPoints: []
                    }]
            });

            // Ajax request for getting JSON data
            //Replace data.php with your JSON API's url

            $.getJSON("data.php", function (data) {

                for (var i = 0; i < data.length; i++) {

                    dataPoints.push({ label: data[i].source, y: data[i].sourcecount });
                }

                chart.options.data[0].dataPoints = dataPoints;
                chart.render();
            });
        });
    </script>
</head>
<body>
    <div id="chartContainer" style="width: 50%; height: 300px;"></div>
</body>
</html>