Login to Ask a Question or Reply
Home › Forums › Feature Requests & Feedback › Multiple dynamic data › Reply To: Multiple dynamic data
Hello,
After looking into your code we found couple of issues. Please correct the below mentioned issues:
1) You are adding both the series inside same object while they should be two different objects as shown below.
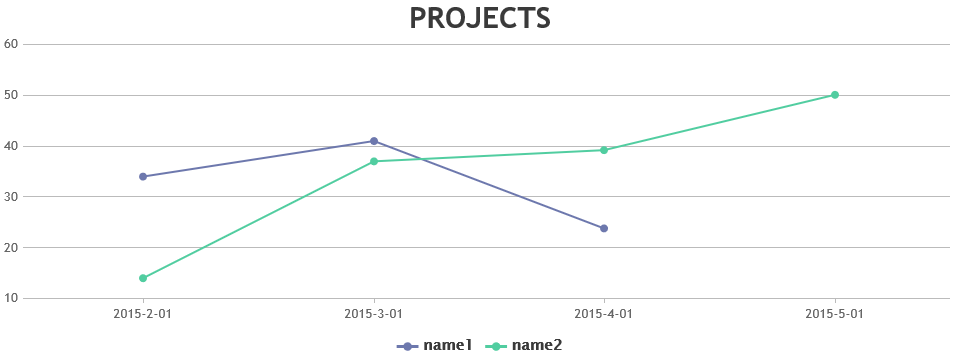
`[
{
“type”: “line”,
“showInLegend”: “true”,
“name”: “name1”,
“dataPoints”: [
{ “x”: “2015-3-01”, “y”: 34 },
{ “x”: “2015-4-01”, “y”: 41 },
{ “x”: “2015-5-01”, “y”: 23.800000026822 }
]
},
{
“type”: “line”,
“showInLegend”: “true”,
“name”: “name2”,
“dataPoints”: [
{ “x”: “2015-2-01”, “y”: 14 },
{ “x”: “2015-3-01”, “y”: 37 },
{ “x”: “2015-4-01”, “y”: 39.20000000298 },
{ “x”: “2015-5-01”, “y”: 50.10000000149 }
]
}
]`
2) In your JSON data, x values are in string form which you need to convert back to Number/Date before assigning it to the chart as shown below.
function displayChart(data) {
	for (var i = 0; i <= data.length - 1; i++) {
		var dataPointss = [];
		for (var j = 0; j <= data[i].dataPoints.length - 1; j++) {
			dataPointss.push({ x: new Date(data[i].dataPoints[j].x), y: data[i].dataPoints[j].y });
		}
		data[i].dataPoints = dataPointss;
		chart.options.data[i] = data[i];
	}
	chart.render();
}
Below is the code with issue fixed:
var chart = new CanvasJS.Chart("chartContainer",
{
	zoomEnabled: false,
	animationEnabled: true,
	title:{
		text: "PROJECTS"
	},
	axisY2:{
		valueFormatString:"0.0 days",
		interlacedColor: "#F5F5F5",
		gridColor: "#D7D7D7",
		tickColor: "#D7D7D7"
	},
	theme: "theme2",
	toolTip:{
		shared: true
	},
	legend:{
		verticalAlign: "bottom",
		horizontalAlign: "center",
		fontSize: 15,
		fontFamily: "Lucida Sans Unicode",
		cursor:"pointer",
		itemclick : function(e) {
		if (typeof(e.dataSeries.visible) === "undefined" || e.dataSeries.visible) {
			e.dataSeries.visible = false;
		}
		else {
			e.dataSeries.visible = true;
		}
		chart.render();
		}
	},
	data: []
});

function displayChart(data) {
	for (var i = 0; i <= data.length - 1; i++) {
		var dataPointss = [];
		for (var j = 0; j <= data[i].dataPoints.length - 1; j++) {
			dataPointss.push({ label: data[i].dataPoints[j].x, y: data[i].dataPoints[j].y });
		}
		data[i].dataPoints = dataPointss;
		chart.options.data[i] = data[i];
	}
	chart.render();
}

function1();

function function1(){
	return $.ajax({
		type: "GET",
		url: "data1.js",
		dataType: "json",
		error: function(){
			alert("impossible de chercher ce project");
		},
		success: function (json) { displayChart(json); }
	});
}
__
Anjali