Login to Ask a Question or Reply
Home › Forums › Chart Support › Remove all paddings and margins › Reply To: Remove all paddings and margins
March 5, 2015 at 6:58 pm
#8307
dodo,
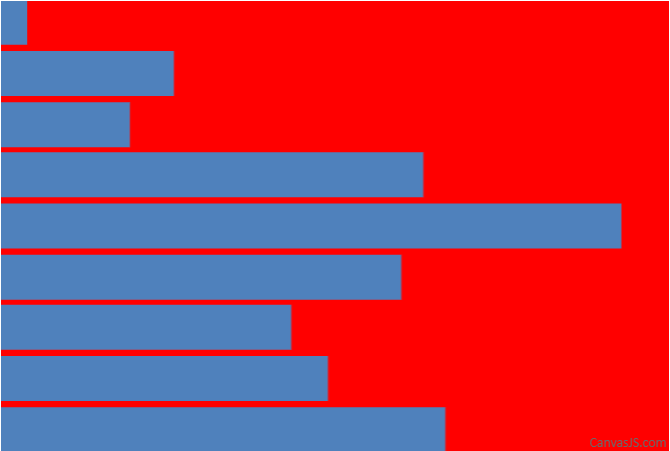
As you are looking to remove margin from all four sides, you can add a dummy dataSeries with no dataPoints and secondary axisX and axisY. Code snippet shared below shows the same:
var chart = new CanvasJS.Chart("chartContainer",{
  backgroundColor: "red",
  axisX: {
    valueFormatString: " ",
    lineThickness: 0,
    gridThickness: 0,
    tickLength: 0,
    margin: -10,
  },
  axisY: {
    valueFormatString: " ",
    lineThickness: 0,
    gridThickness: 0,
    tickLength: 0,
    margin: -10
  },
  axisX2: {
    valueFormatString: " ",
    lineThickness: 0,
    gridThickness: 0,
    tickLength: 0,
    margin: -10,
  },
  axisY2: {
    valueFormatString: " ",
    lineThickness: 0,
    gridThickness: 0,
    tickLength: 0,
    margin: -10
  },
  data: [
    {
      type: "bar",
      dataPoints: [
        { x: 10, y: 71 },
        { x: 20, y: 55},
        { x: 30, y: 50 },
        { x: 40, y: 65 },
        { x: 50, y: 95 },
        { x: 60, y: 68 },
        { x: 70, y: 28 },
        { x: 80, y: 34 },
        { x: 90, y: 14}
      ]
    },
    {
      type: "bar",
      axisXType: "secondary",
      axisYType: "secondary",
      dataPoints: []
    }
  ]
});

chart.render();
Please take a look at this JSFiddle for a working example with sample code.

__
Anjali
Team CanvasJS