Login to Ask a Question or Reply
Home › Forums › StockChart Support › How to render non-continuous time intervals separately in CanvasJS StockCharts? › Reply To: How to render non-continuous time intervals separately in CanvasJS StockCharts?
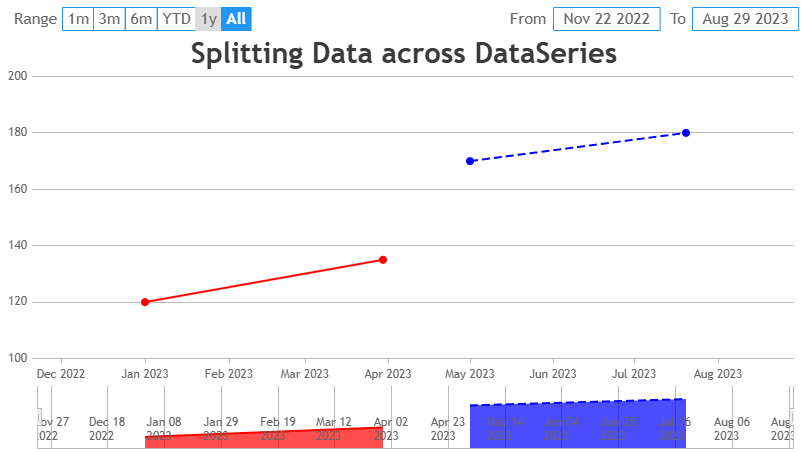
Yes, you can achieve this in CanvasJS by splitting your data into multiple series, each representing a specific time period. Each series can have its own unique styling, such as different colors, line dash-type or markers. Since the x-axis is time-based, CanvasJS will automatically create gaps for the periods without data (like April or August) and the series will overlap if needed. Please have a look at the below code snippet for splitting the data across multiple dataseries.
data: [{
  type: "line",
  dataPoints: [
    { x: new Date(2023, 0, 1), y: 120 },
    { x: new Date(2023, 2, 30), y: 135 }
  ],
  color: "#FF0000"  // Red for Jan-Mar
}, {
  type: "line",
  dataPoints: [
    { x: new Date(2023, 4, 1), y: 170 },
    { x: new Date(2023, 6, 20), y: 180 }
  ],
  color: "#0000FF",  // Blue for May-Jul
  lineDashType: "dash"   // Dashed line style
}]
Also, check out this JSFiddle for complete code.

—-
Manoj Mohan
Team CanvasJS