Adam Evans,
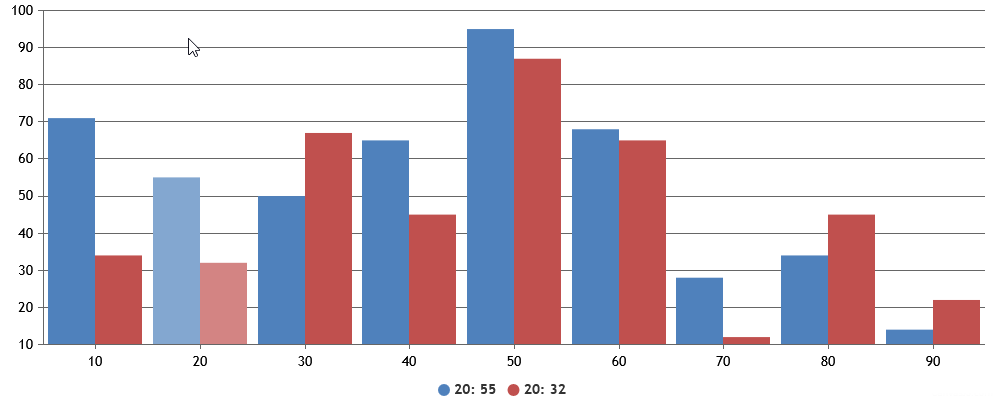
To achieve this, you can make use of the updated event to track the current x and y-values, and display those values dynamically in the legend. By utilizing shared tooltip, the values from different chart series can be synchronized and displayed consistently in the legend. Please take a look at this JSFiddle for an example of the same.
—
Vishwas R
Team CanvasJS