Login to Ask a Question or Reply
Home › Forums › Chart Support › How to show grid-lines when chart data is empty? › Reply To: How to show grid-lines when chart data is empty?
July 15, 2024 at 6:25 pm
#45541
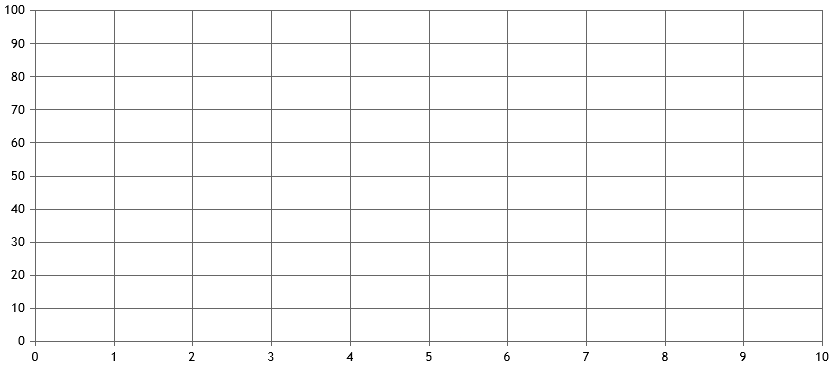
To ensure axis grids are displayed, you need to pass an empty dataseries & specify the chart type (like “line” or “column”, defaults to “column”) along with grid-options. You need to explicitly pass empty dataseries as axis is not present in chart-types like pie, doughnut, funnel & pyramid. Hence, the axis elements passed in options are not considered when chart-type is unknown – when data is an empty array. Changing data:[] to data:[{}] should work fine in your case. Please take a look at this JSFiddle for an example of the same.
—
Vishwas R
Team CanvasJS