@kpandey017,
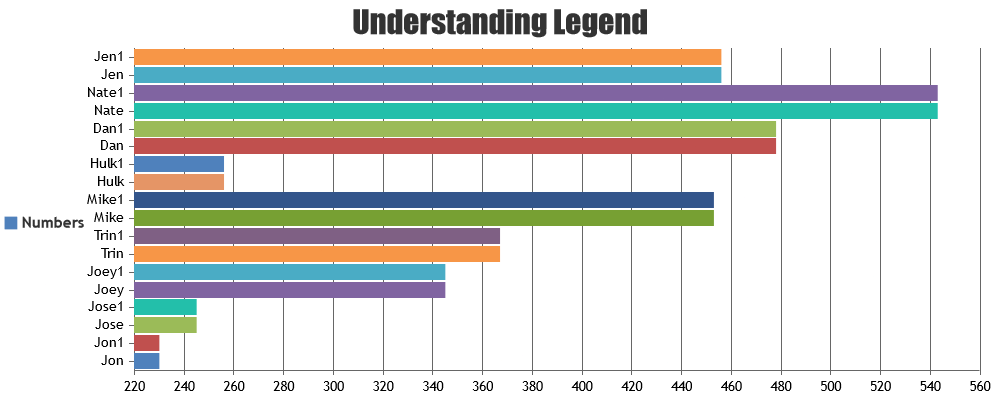
Labels are displayed at regular intervals on the axis. Additionally, to enhance readability and prevent overlapping, the chart omits alternate labels, in some cases. However, if you prefer to display all labels, you can achieve this by setting the interval to 1.
axisX: {
  interval: 1
}
Please take a look at this updated JSFiddle for the working code.

—
Vishwas R
Team CanvasJS