@chteow,
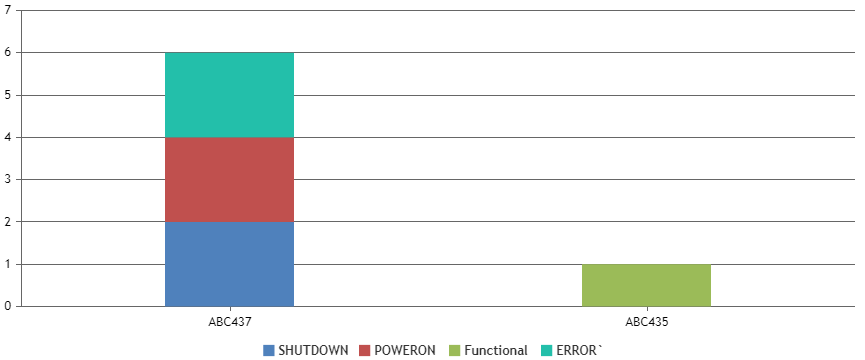
In the case of Stacked Charts, datapoints across multiple dataseries are aligned based on x-values and not labels. Passing x-value along with the label should work fine in this case.
Please take a look at this JSFiddle for a working example on the same.
—
Thangaraj Raman
Team CanvasJS