@neha,
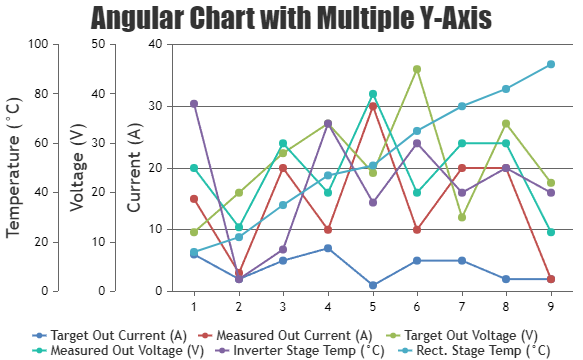
You can create a chart with 3 y-axes for Current, Voltage, and Temperature and use the axisYIndex property to assign each dataseries to a particular y-axis.
Please check this StackBlitz for a working example on the same.
—
Manoj Mohan
Team CanvasJS