@lujakob,
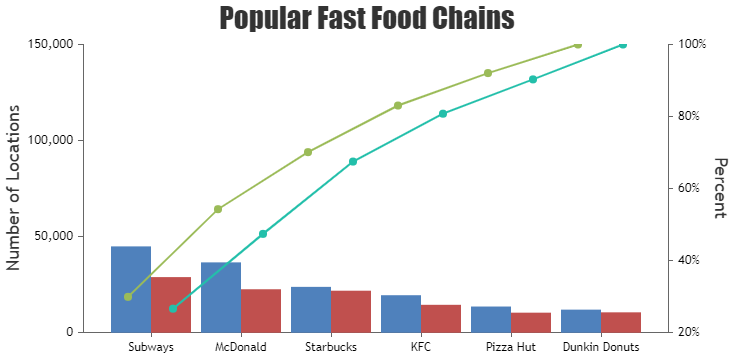
You can add an offset to the x-values in the line chart in order to align them to their respective columns as shown in the code snippet below:
dps1.push({label: chart.data[0].dataPoints[i].label, x: chart.data[0].dataPoints[i].x - 0.25, y: yPercent1});
dps2.push({label: chart.data[0].dataPoints[i].label, x: chart.data[0].dataPoints[i].x + 0.25, y: yPercent2});
Please check this updated StackBlitz for a working example.

—
Thangaraj Raman
Team CanvasJS