@lujakob,
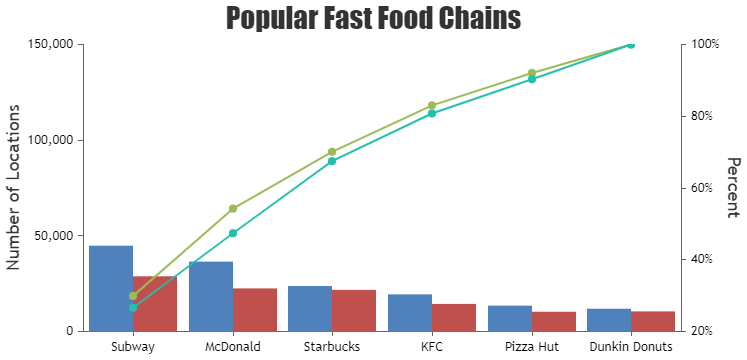
You can add another column dataseries to the chart, and apply the same logic as in the Angular Pareto Chart gallery example to create another line series.
Please take a look at this StackBlitz for a working example.

—
Thangaraj Raman
Team CanvasJS