Login to Ask a Question or Reply
Home › Forums › Chart Support › Bar Chart not plotting for x: 200 and y:1688551280204000 dataPoints › Reply To: Bar Chart not plotting for x: 200 and y:1688551280204000 dataPoints
August 3, 2023 at 9:30 am
#43471
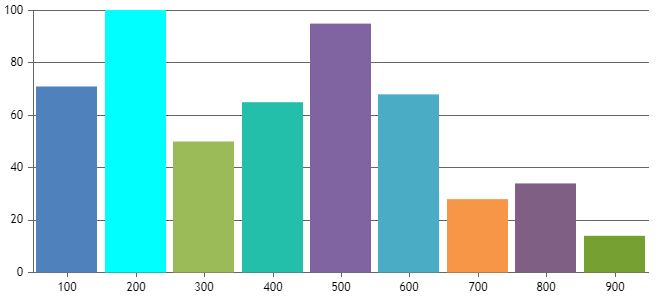
Thanks for reporting the use-case, we will investigate it further. Meanwhile, removing maximum seems to be working fine. Also, you can use scalebreaks to collapse the unnecessary region to make it better.
axisY: {
  includeZero: true,
  minimum: 0,
  maximum: 100,
  scaleBreaks: {
    autoCalculate: true
  }
},
Kindly refer to this JSFiddle for the working example on the same.

__
Sachin Bisht
Team CanvasJS