Login to Ask a Question or Reply
Home › Forums › Chart Support › Show min and max value in half doughnut chart › Reply To: Show min and max value in half doughnut chart
July 26, 2023 at 6:35 pm
#43425
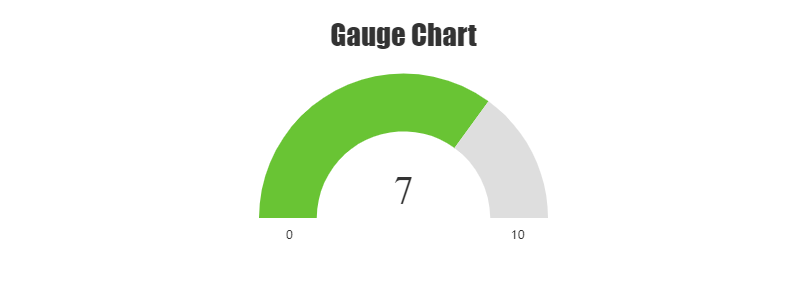
You can add 2 dummy datapoints in the hidden region of the doughnut chart and use their indexlabels to show the minimum and maximum value of the gauge as shown in the code snippet below:
var data = {
    type: "doughnut",
    indexLabelPlacement: "inside",
    innerRadius: "60%",
    dataPoints: [
      {
        y: 1,
        indexLabel: gauge.maximum + "",
        color: "transparent"
      },
      {
        y: gauge.maximum - 2,
        color: "transparent",
        toolTipContent: null
      },
      {
        y: 1,
        indexLabel: "0",
        color: "transparent"
      },
      gauge.data,
      gauge.unoccupied,
   ],
};
Please check this JSFiddle for a working example.

—
Thangaraj Raman
Team CanvasJS