@gibran-shah,
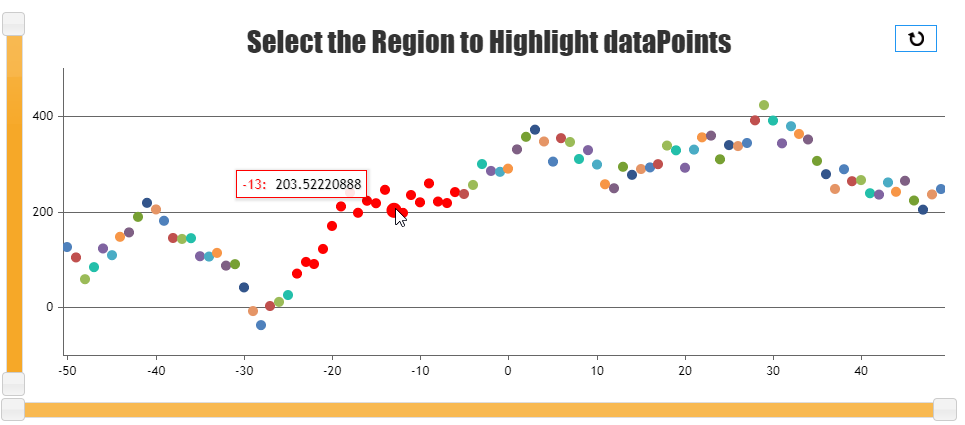
You can use datapoint / dataseries click event-handler to change the color of the datapoint on clicking them. Please refer to the code-snippet below.
click: function(e) {
  e.chart.options.data[e.dataSeriesIndex].dataPoints[e.dataPointIndex].color = "red";
  e.chart.render();
}
Please take a look at this updated JSFiddle for working code.

—
Vishwas R
Team CanvasJS