@antosimi,
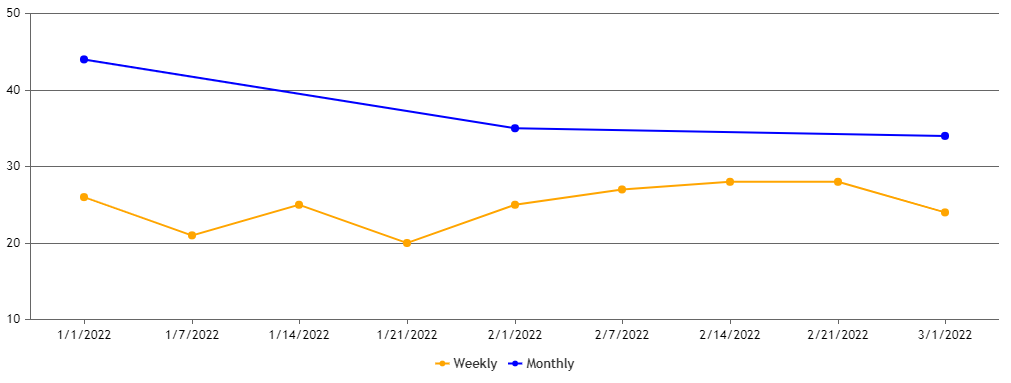
You can set x-value along with y-value and labels sequentially starting from 0. In case a particular dataseries does not have datapoints for each x-value, you can skip them.
Please take a look at this JSFiddle for a working example.

—
Thangaraj Raman
Team CanvasJS