Login to Ask a Question or Reply
Home › Forums › Chart Support › Bubble chart- connect two bubbles › Reply To: Bubble chart- connect two bubbles
December 15, 2022 at 7:43 pm
#41676
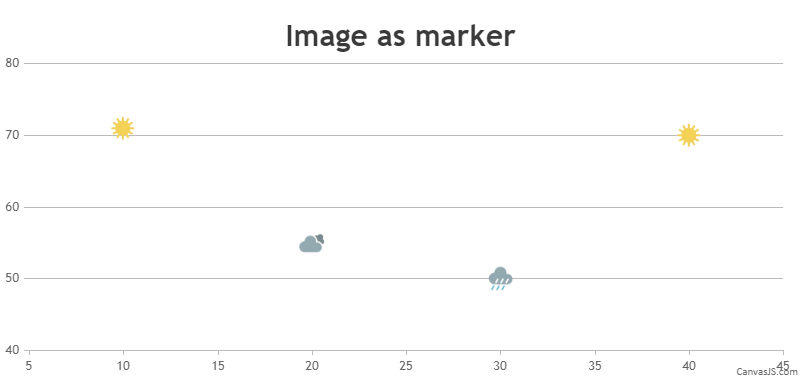
Replacing bubble with custom image/svg is not available as an inbuilt feature as of now. However, you can position images in place of markers in bubble chart by adding few lines of code. Please checkout the code snippet below for the same.
addMarkerImages(chart);

function addMarkerImages(chart){
  for(var i = 0; i < chart.data[0].dataPoints.length; i++){

    customMarkers.push($("<img>").attr("src", chart.data[0].dataPoints[i].markerImageUrl)
                       .css("display", "none")
                       .css("height", 30)
                       .css("width", 30)
                       .css("pointer-events", "none")
                       .appendTo($("#chartContainer>.canvasjs-chart-container"))
                      );
    positionMarkerImage(customMarkers[i], i);
  }
}

function positionMarkerImage(customMarker, index){
  var pixelX = chart.axisX[0].convertValueToPixel(chart.options.data[0].dataPoints[index].x);
  var pixelY = chart.axisY[0].convertValueToPixel(chart.options.data[0].dataPoints[index].y);

  customMarker.css({"position": "absolute",
                    "display": "block",
                    "top": pixelY - customMarker.height()/2,
                    "left": pixelX - customMarker.width()/2,
                    "pointerEvents": "none"
                   });
}
Please take a look at this JSFiddle for complete working code.
2) How can I connect two bubbles with a straight line on mouse hover?
It is not possible to connect two bubble with a straight line on mouse hover as of now.
—-
Manoj Mohan
Team CanvasJS