Login to Ask a Question or Reply
Home › Forums › Chart Support › Synchronized Charts › Reply To: Synchronized Charts
November 30, 2022 at 6:52 pm
#40153
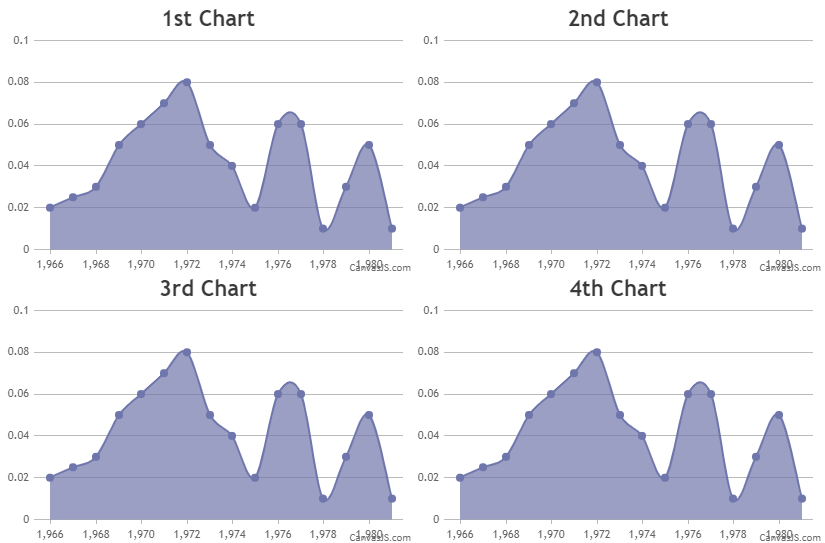
Passing datapoints as an array of objects to chart options should work fine in your case. Please find the code-snippet given below.
var chartOptions1 = {
    animationEnabled: true,
    theme: "light2",
    title:{
      text: "1st Chart"
    },
    data: [{
      type: "splineArea",
      dataPoints: [
        { x: 1966 , y: 0.020},
        { x: 1967 , y: 0.025},
        { x: 1968 , y: 0.030},
        { x: 1969 , y: 0.050},
        { x: 1970 , y: 0.060},
        { x: 1971 , y: 0.070},
        { x: 1972 , y: 0.080},
        { x: 1973 , y: 0.050},
        { x: 1974 , y: 0.040},
        { x: 1975 , y: 0.020},
        { x: 1976 , y: 0.060},
        { x: 1977 , y: 0.060},
        { x: 1978 , y: 0.010},
        { x: 1979 , y: 0.030},
        { x: 1980 , y: 0.050},
        { x: 1981 , y: 0.010}
      ]
    }]
  };
.
.
.
Also, check out this JSFiddle for complete working code.
—-
Manoj Mohan
Team CanvasJS