Login to Ask a Question or Reply
Home › Forums › Chart Support › Stripline – index label position – adjustments › Reply To: Stripline – index label position – adjustments
November 22, 2022 at 7:25 pm
#40020
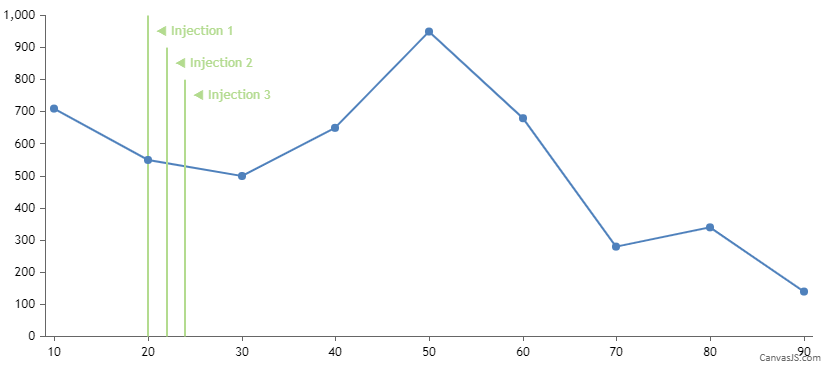
Striplines are drawn from end to end across the full width/height of the plot-area. However, in your case, you can use a multi-series line chart with interactivity disabled and 2 datapoints each to represent the start and end coordinates of the line. To display text representing each line, you can use a scatter chart with indexlabels.
Please take a look at this JSFiddle for a working example.

—
Thangaraj Raman
Team CanvasJS