Login to Ask a Question or Reply
Home › Forums › Chart Support › Click event on whole chart area › Reply To: Click event on whole chart area
August 30, 2022 at 6:58 pm
#39034
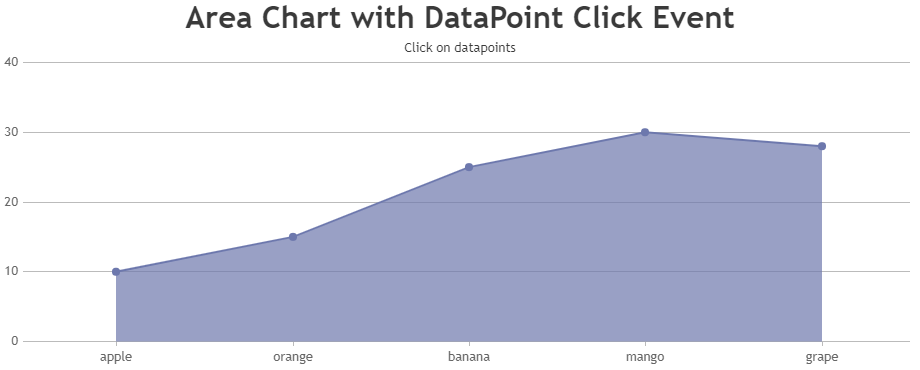
To show datapoint information on clicking part of area chart as well, you can bind a click event on chart container and with the help of tooltip updated event, you can display the information about datapoint when clicked. Please take at the below code snippet for the same.
let currentViewedDps = [];
.
toolTip: {
  updated: function (e) {
    currentViewedDps = [];
    e.entries.forEach((entry) => {
      currentViewedDps.push(entry.dataPoint);
    });
  },
    hidden: function (e) {
      currentViewedDps = [];
    },
}
.
.
useEffect(() => {
  if (chart != null) {
    chart.container.addEventListener('click', handleClick);
    return function () {
      chart.container.removeEventListener('click', handleClick);
    };
  }
});
.
.
Also, check out this StackBlitz project for complete code.

—-
Manoj Mohan
Team CanvasJS