Login to Ask a Question or Reply
Home › Forums › Chart Support › Axis rounding iusse › Reply To: Axis rounding iusse
July 15, 2022 at 6:16 pm
#38698
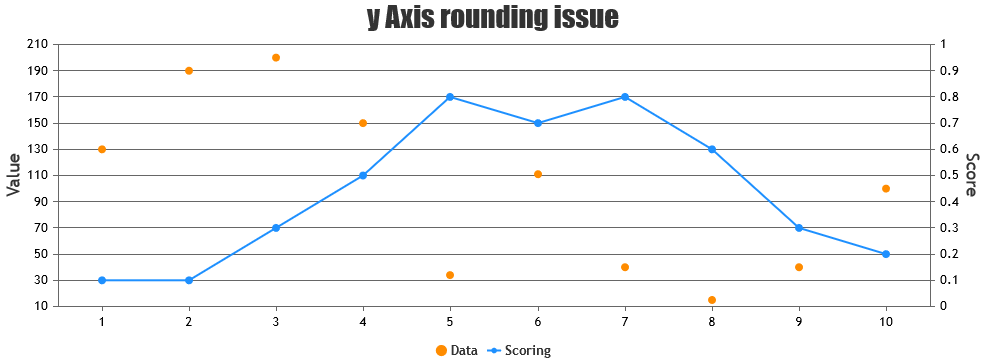
Sorry, controlling the first label on the axes & showing labels at every interval as per position of first label is not available, as of now. Minimum & maximum will set the axis range & not the position from where the axis labeling should start. However, you can disable axis labels & use striplines to achieve this. Below is the code-snippet that shows adding striplines with labels to y-axis.
function addStripLines(chart) {
  for (var i = chart.axisY[0].minimum; i <= chart.axisY[0].maximum; i += chart.axisY[0].interval) {
    chart.options.axisY.stripLines.push({
      value: i,
      label: i,
      labelPlacement: "outside",
      labelFontColor:"black",
      labelBackgroundColor: "transparent",
      color: chart.axisY[0].gridColor
    });
  }
  chart.render()
}
Please take a look at this updated JSFiddle for complete code.

—
Vishwas R
Team CanvasJS