@ct101,
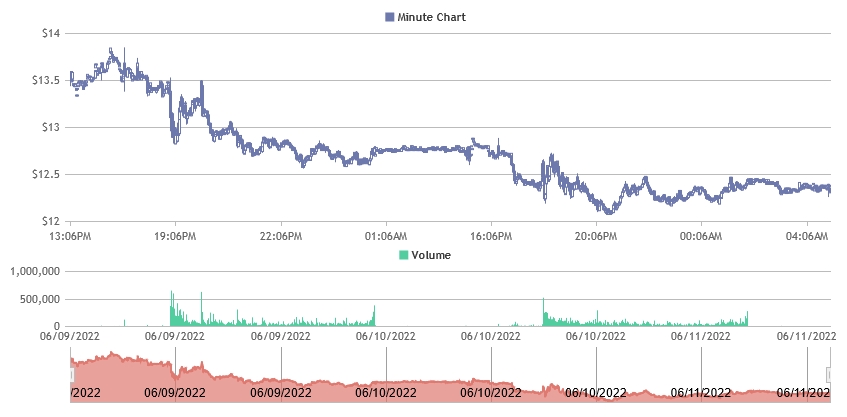
You are using value in labelFormatter instead of label, as you are passing date as label instead of x-value. Please find the updated code-snippet below.
labelFormatter: function(e) {
  return CanvasJS.formatDate(e.label, "HH:MMTT");
}
Please take a look at this updated JSFiddle for complete code.

—
Vishwas R
Team CanvasJS