@stefan-alfs,
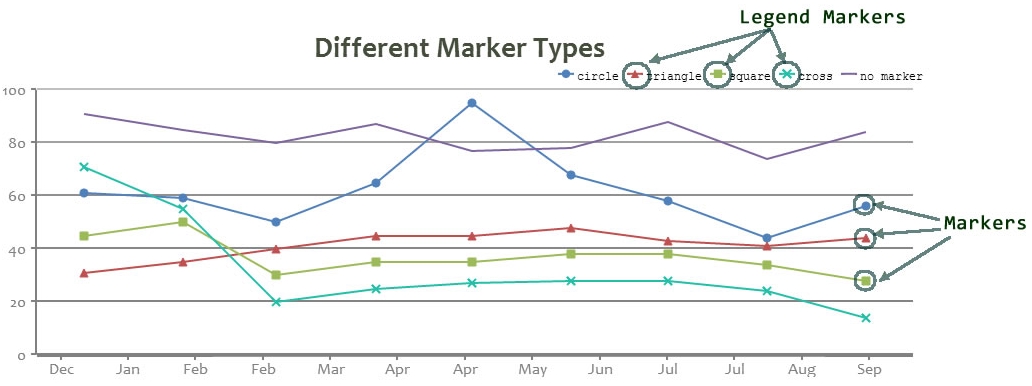
You can use markers to show circle, square, triangle or cross in line charts. Please refer to documentation for more information along with live examples that you can try out.
If this doesn’t fit your requirements can you kindly share some example or pictorial representation of what you are looking for so that we can understand your requirement better & help you out?
—
Vishwas R
Team CanvasJS