Home › Forums › Chart Support › 1 Spline Chart with two lines › Reply To: 1 Spline Chart with two lines
@phillips321,
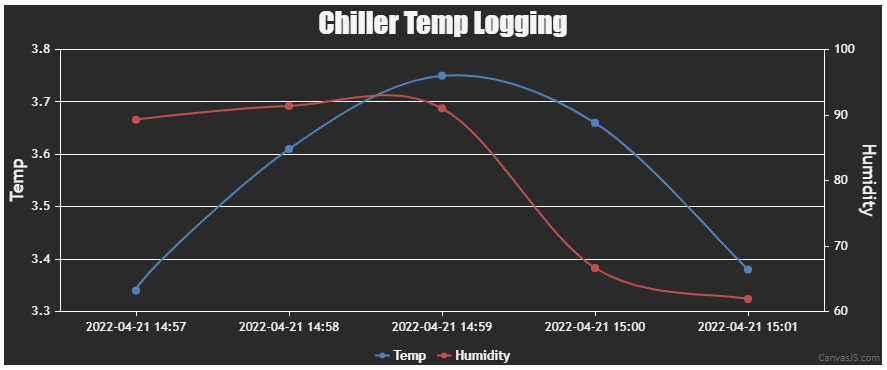
You can set axisYType property as “secondary” for the humidity dataSeries to plot it against the secondary y-axis.
Kindly take a look at this updated JSFiddle for a working example.
— Thangaraj Raman Team CanvasJS