Login to Ask a Question or Reply
Home › Forums › Chart Support › 1 Spline Chart with two lines › Reply To: 1 Spline Chart with two lines
April 22, 2022 at 8:17 pm
#37529
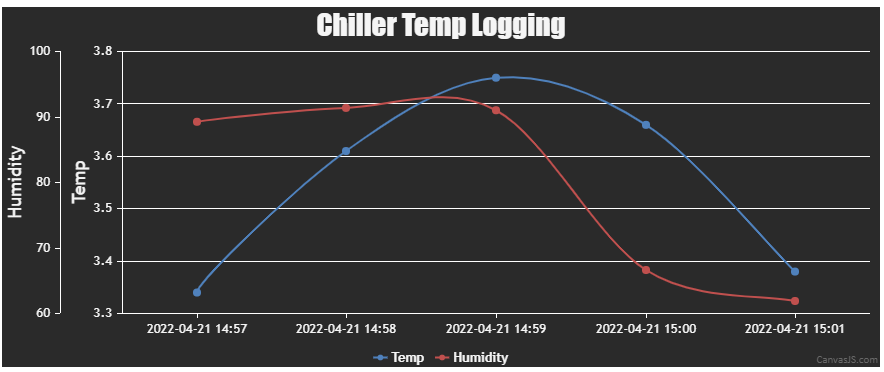
It is possible to create a multi-series chart with data from a CSV file. Please find the code snippet for the same below.
function getDataPointsFromCSV(csv) {
  var dataPoints, csvLines, points;
  dataPoints = csvLines = points = [];
  csvLines = csv.split(/[\r?\n|\r|\n]+/);
  for (var i = 1; i < csvLines.length; i++)
    if (csvLines[i].length > 0) {
      points = csvLines[i].split(",");
      chart.options.data[0].dataPoints.push({label: points[0], y: parseFloat(points[1])});
      chart.options.data[1].dataPoints.push({label: points[0], y: parseFloat(points[2])});
    }
}
Kindly take a look at this updated JSFiddle for a working example.
—
Thangaraj Raman
Team CanvasJS