Login to Ask a Question or Reply
Home › Forums › Chart Support › on Click Event I Want to Show Tooltip › Reply To: on Click Event I Want to Show Tooltip
April 11, 2022 at 8:11 pm
#37386
You can use tooltip’s showAtX method along with click event handler of dataSeries to show tooltip on clicking datapoint. Please check out the code snippet below.
var clicked = false;
var chart = new CanvasJS.Chart("chartContainer",
{
title:{
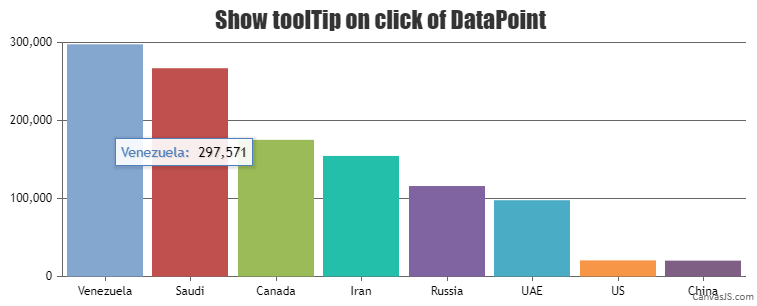
text: "Show toolTip on click of DataPoint"
},
toolTip: {
updated: function(e) {
// hide tooltip if datapoint is not clicked
if(!clicked)
e.chart.toolTip.hide();
}
},
data: [
{
click: showToolTipOnClick,
mouseout: hideToolTip,
dataPoints: [
{ x: 1, y: 297571, label: "Venezuela"},
{ x: 2, y: 267017, label: "Saudi"},
{ x: 3, y: 175200, label: "Canada"},
{ x: 4, y: 154580, label: "Iran"},
{ x: 5, y: 116000, label: "Russia"},
{ x: 6, y: 97800, label: "UAE"},
{ x: 7, y: 20682, label: "US"},
{ x: 8, y: 20350, label: "China"}
]
}
]
});
chart.render();
function showToolTipOnClick(e) {
clicked = !clicked;
clicked ? e.chart.toolTip.showAtX(e.dataPoint.x) : e.chart.toolTip.hide();
}
function hideToolTip(e) {
clicked = false;
e.chart.toolTip.hide()
}Also, please take a look at this JSFiddle for complete working code.
—-
Manoj Mohan
Team CanvasJS