Login to Ask a Question or Reply
Home › Forums › Chart Support › How to Draw Vertical Line › Reply To: How to Draw Vertical Line
April 8, 2022 at 6:38 pm
#37367
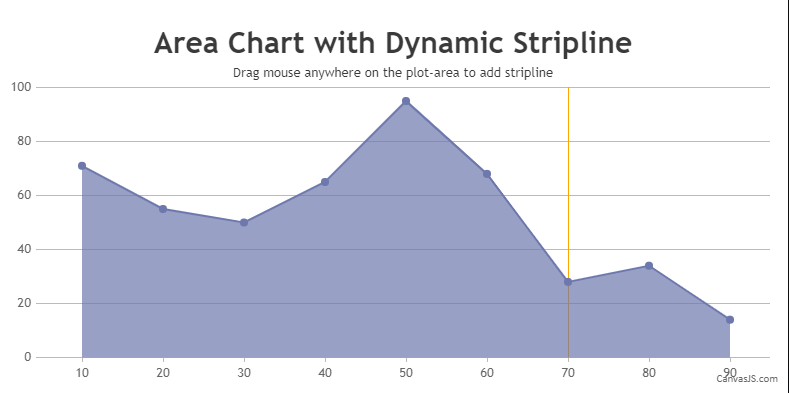
It is possible to add stripLines dynamically on a chart by binding mouse events to the chart as shown in the code-snippet below,
$(".canvasjs-chart-canvas").last().on("mousedown", function(e) {
  var parentOffset = $(this).parent().offset();
  var relX = e.pageX - parentOffset.left;
  var relY = e.pageY - parentOffset.top;
  chart.options.axisX[0].stripLines = []; //Comment this line to add as many stripLine based on mouse events than single stripline
  startValue = chart.axisX[0].convertPixelToValue(relX);
});

$(".canvasjs-chart-canvas").last().on("mouseup", function(e) {
  var parentOffset = $(this).parent().offset();
  var relX = e.pageX - parentOffset.left;
  var relY = e.pageY - parentOffset.top;

  endValue = chart.axisX[0].convertPixelToValue(relX);
  if(startValue === endValue)
    chart.options.axisX[0].stripLines.push({value: startValue });
  else
    chart.options.axisX[0].stripLines.push({startValue: startValue, endValue: endValue});
  chart.render();
});
Kindly take a look at this JSFiddle for an example with complete code.
—
Adithya Menon
Team CanvasJS