@tiapoo,
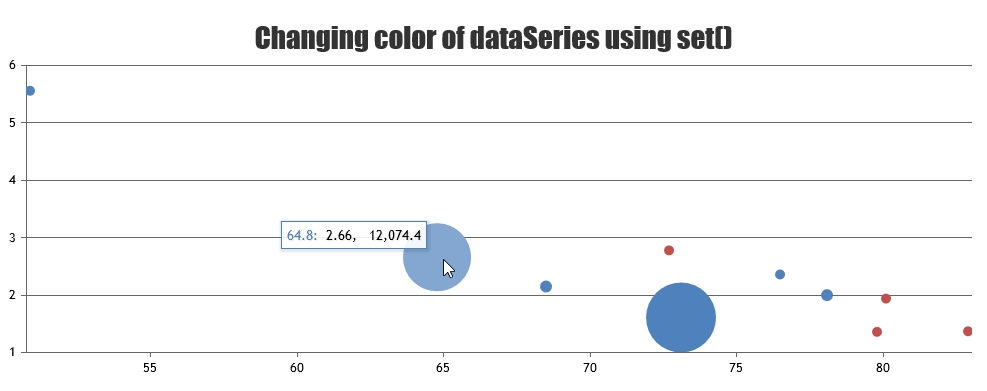
Tooltip accepts the color of datapoint as it’s border-color by default & it seems to be working fine. Please refer to the screenshot below.
If you are still facing issue, can you kindly create JSFiddle & share it with us so that we can look into the code / chart-options being used, understand the scenario better and help you out?
—
Thangaraj Raman
Team CanvasJS