@pauls,
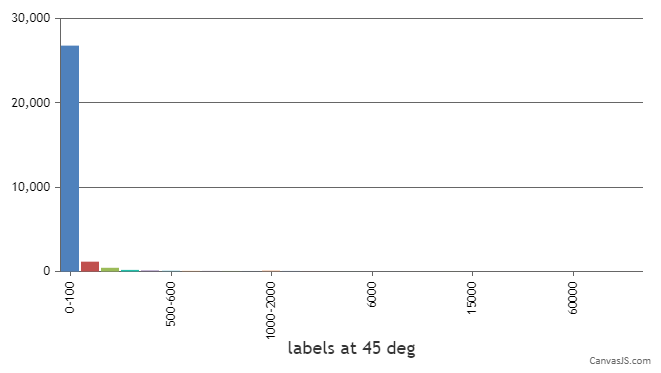
To create a chart as per your requirement, you can go ahead and remove the x values passed to the dataPoints array. Passing only label and y properties to dataPoints should work fine in your case.
Kindly take a look at this updated JSFiddle for an example with complete code.

—
Adithya Menon
Team CanvasJS