Login to Ask a Question or Reply
Home › Forums › Chart Support › Line Chart Connector Colors › Reply To: Line Chart Connector Colors
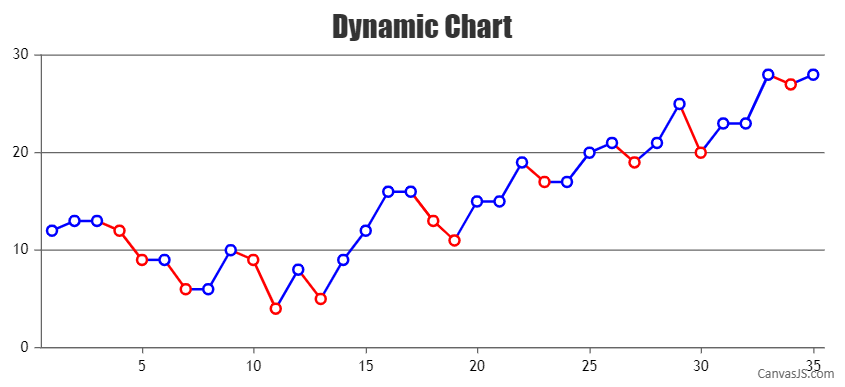
To render a dynamic chart, you will have to create a function that checks the dataPoint value before assigning it to the chart options/data and accordingly customize the markerBorderColor and lineColor. The function can be called at regular intervals to add new dataPoint using setInterval() as shown in the code snippet below –
var updateChart = function () {

  yVal = yVal +  Math.round(5 + Math.random() *(-5-5));

  if(dps.length && yVal < dps[dps.length - 1].y)
  {
    dps.push({x: xVal,y: yVal, markerBorderColor: "red"});
    dps[dps.length - 2].lineColor = "red";
  }
  else if(dps.length)
  {
    dps.push({x: xVal, y: yVal, markerBorderColor: "blue"});
    dps[dps.length - 2].lineColor = "blue";
  }
  else
    dps.push({x: xVal, y: yVal, markerBorderColor: "blue"});

  xVal++;
  chart.render();
};
setInterval(function(){updateChart()}, updateInterval);
Please take a look at this documentation page for a step-by-step tutorial to create a dynamic chart that updates dataPoints at regular intervals. Also, take a look at this JSFiddle for a working example.
In case this doesn’t fulfill your requirement, kindly brief us further about the logic based on which the line color is defined.
___________
Indranil Singh Deo
Team CanvasJS