Login to Ask a Question or Reply
Home › Forums › Chart Support › Marker image on multiple datapoints with multiple lines › Reply To: Marker image on multiple datapoints with multiple lines
February 16, 2022 at 6:46 pm
#36956
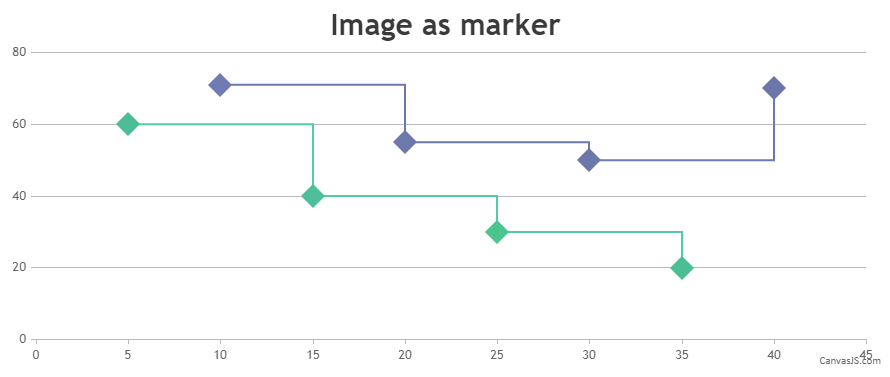
Changing the color of SVG image can be done by applying filter property. You can use hexToCSSFilter package to do so. You can set the color of the SVG images to the color of particular dataseries as shown in the code snippet below.
for (var j = 0; j < chart.data[i].dataPoints.length; j++) {
      customMarkers[i].push($("<img>").attr("src", chart.data[i].dataPoints[j].markerImageUrl)
                            .css("display", "none")
                            .css("height", 5)
                            .css("width", 5)
                            .css("filter", hexToCSSFilter(chart.data[i].color))
                            .appendTo($("#chartContainer>.canvasjs-chart-container"))
                           );
      positionMarkerImage(customMarkers[i][j], i, j);
    }
Also, check out this JSFiddle for working sample.
Ranjitha R
Team CanvasJS