Login to Ask a Question or Reply
Home › Forums › Chart Support › Background for area covered by line › Reply To: Background for area covered by line
February 1, 2022 at 6:20 pm
#36851
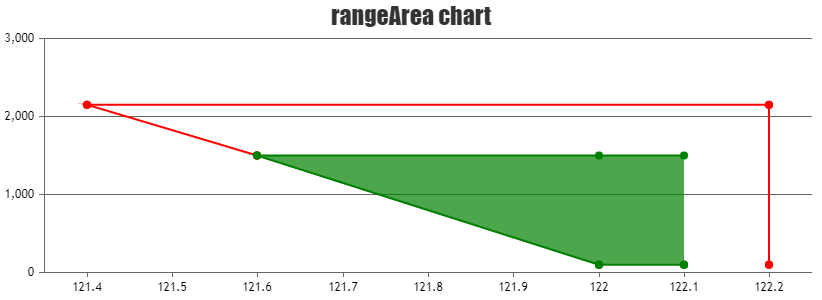
You can plot more than one dataseries to display the multi-series range-area chart. Please find the code-snippet below.
data: [
  {
    type: "rangeArea",
    color: "red",
    dataPoints: [
      { x: 122.2, y: [100,100]},
      { x: 122.2, y: [2150,2150]},
      { x: 121.4, y: [2150,2150]},
      { x: 121.6, y: [1500,1500]},
    ]
  },
  {
    type: "rangeArea",
    color: "green",
    dataPoints: [
      { x: 122.1, y: [100,1500]},
      { x: 122,   y: [100,1500]},
      { x: 121.6, y: [1500,1500]},
      { x: 122,   y: [100,100]},
      { x: 122.1, y: [100,100]},
    ]
  }]
Also, Please take a look at this JSFiddle for working sample.
—-
Ranjitha R
Team CanvasJS