@saurav-rox,
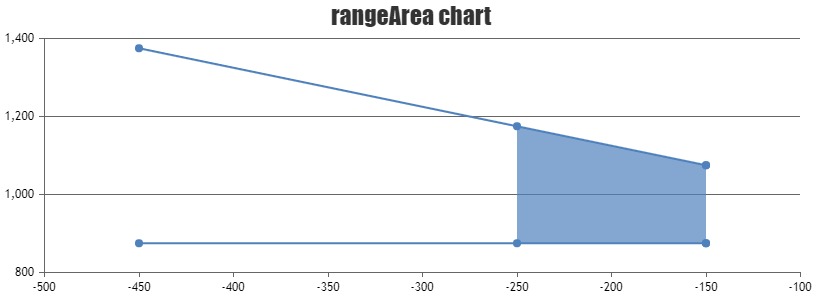
You can use range-area chart to fill certain region of the series with a background color. Please find the code-snippet below.
data: [
      {
        type: "rangeArea",
        dataPoints: [
          { x: -150, y: [875,1075]},
          { x: -450, y: [875, 1375]},
          { x: -150, y: [875, 1075]},
          { x: -250, y: [875, 1175]}
        ]
      }]
Also, please take a look at this JSFiddle for working example.
—-
Ranjitha R
Team CanvasJS