Login to Ask a Question or Reply
Home › Forums › Chart Support › want to display date with time when we hover over chart › Reply To: want to display date with time when we hover over chart
November 2, 2021 at 7:24 pm
#36193
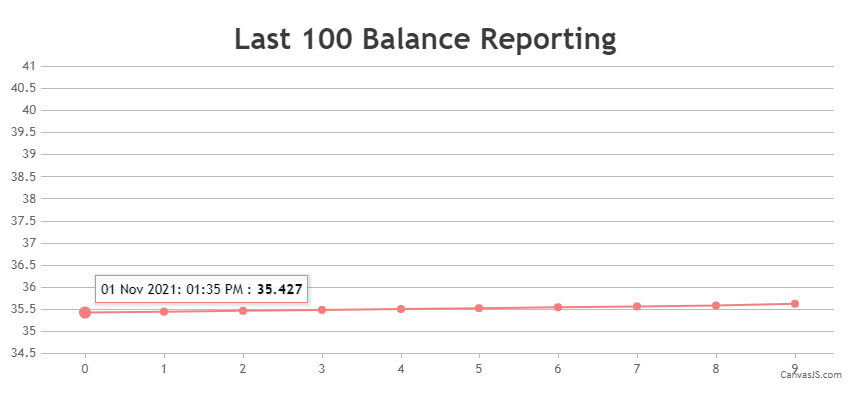
It is possible to add some extra content (in your case timestamp) to the toolTip using contentFormatter property as shown in the code-snippet below,
contentFormatter: function (e) {
      var content = " ";
      for (var i = 0; i < e.entries.length; i++) {
        content += CanvasJS.formatDate(e.entries[i].dataPoint.extraContent, "DD MMM YYYY: hh:mm TT") + " : " + "<strong>" + e.entries[i].dataPoint.y + "</strong>"
        content += "<br/>";
      }
  return content;
}
You will also need to pass the necessary timestamps as a custom property to the dataPoints array as shown in the code-snippet below,
dataPoints: [
      { y: 35.427, extraContent: new Date(2021, 10, 01, 13, 35)},
      { y: 35.447, extraContent: new Date(2021, 10, 01, 14, 35)},
      { y: 35.467, extraContent: new Date(2021, 10, 01, 15, 35)},
      { y: 35.487, extraContent: new Date(2021, 10, 01, 16, 35)},
      ...
]
Kindly take a look at this updated JSFiddle for an example on rendering a chart with additional content on the toolTip.
—
Adithya Menon
Team CanvasJS