Login to Ask a Question or Reply
Home › Forums › Chart Support › type:’line’ Chart on load browser goes to expire page or wait › Reply To: type:’line’ Chart on load browser goes to expire page or wait
October 12, 2021 at 7:16 pm
#36023
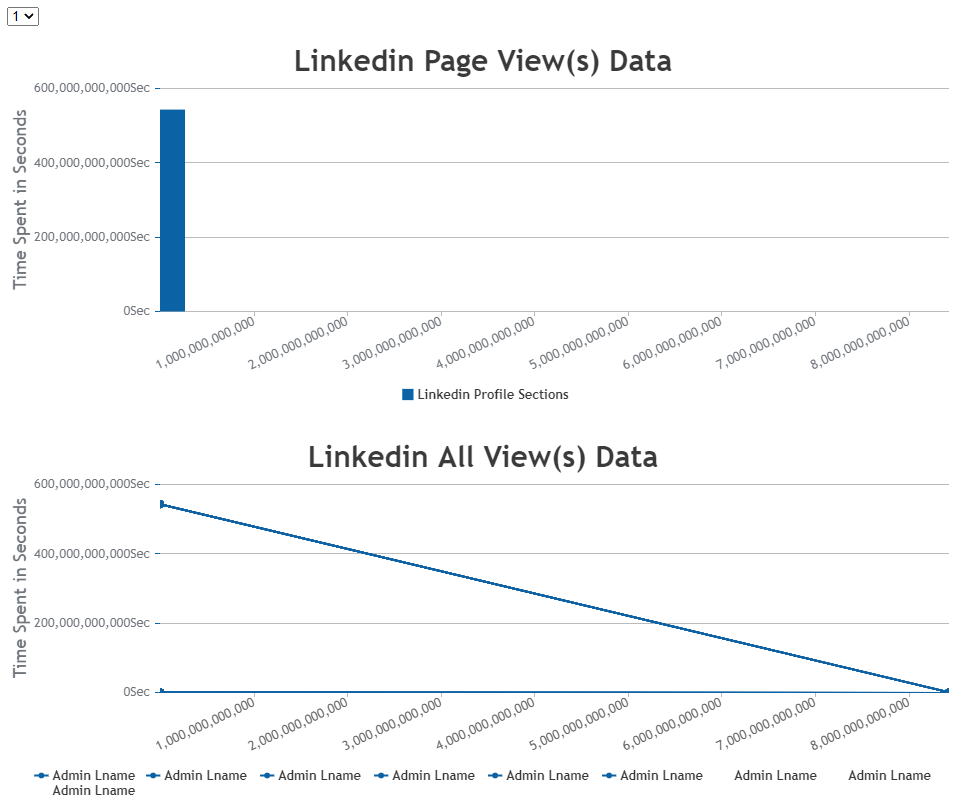
As per the JSFiddle shared by you, we can observe that based on the range of y-axis and interval option the chart is rendering too many labels which is causing the browser to freeze. Hence, removing the interval option for y-axis will allow the library to auto-calculate the interval at which axis labels are to be displayed and it should work fine in your case. Please take a look at this updated JSFiddle.

___________
Indranil Deo
Team CanvasJS