@shalkt,
The datapoint y-value can only accept numeric values as of now. However, you can store a custom option (let’s say yLabel) for the song name and show the same in tooltip with the help of toolTipContent as shown in the code-snippet below.
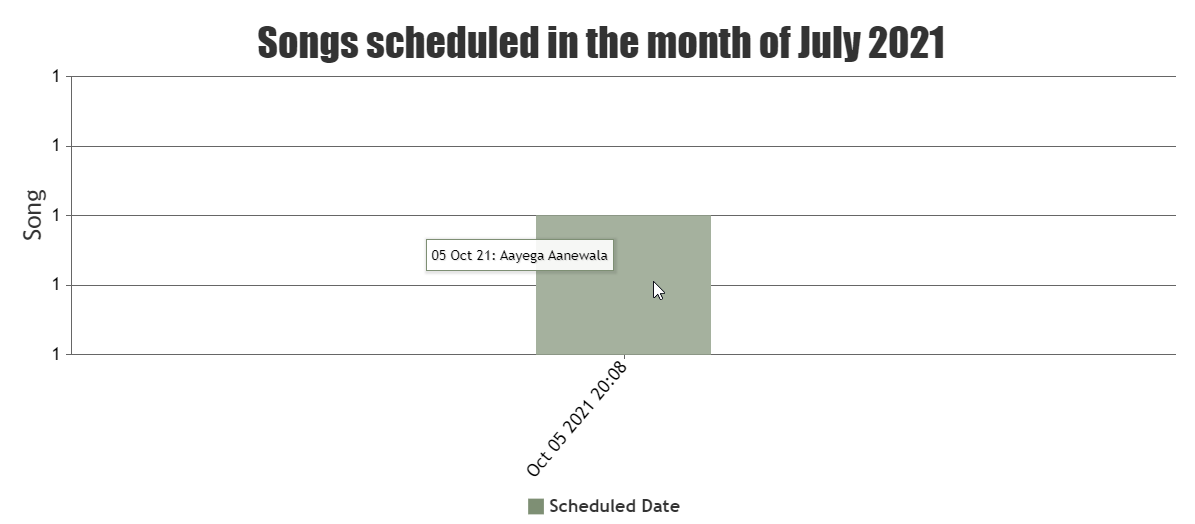
array_push($dataPoints, array("x"=> strtotime($row['sch_date']) * 1000, "y"=> 1, "yLabel"=> $row['label']));
toolTipContent: "{x}: {yLabel}",
Please check this updated project for a working example.
—
Thangaraj Raman
Team CanvasJS