Login to Ask a Question or Reply
Home › Forums › Chart Support › Chart within ToolTip or Chart within a Chart › Reply To: Chart within ToolTip or Chart within a Chart
September 14, 2021 at 7:33 pm
#35726
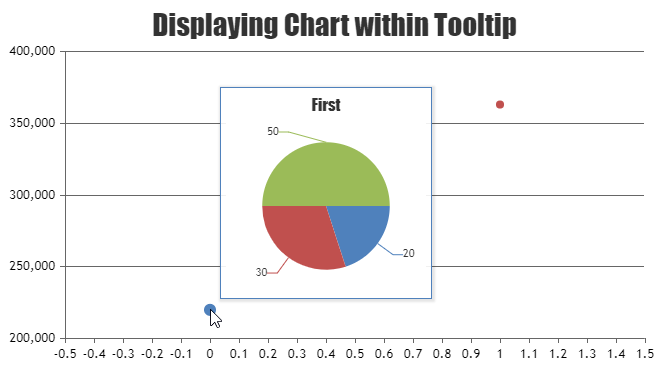
You can pass the pie1, pie2,… values to respective dataPoints of the scatter chart and on displaying the tooltip, you can get the values for pie chart using e.entries[0].dataPoints object. Please take a look at the code snippet below for the same.
.
.
toolTip: {
      updated: function(e) {
        typeof pieChart.destroy === "function" && pieChart.destroy();
        pieChart = new CanvasJS.Chart('pie-chart', chartOptions);
        pieChart.options.title.text = e.entries[0].dataPoint.name;
        pieChart.options.data[0].dataPoints = [];
        pieChart.options.data[0].dataPoints.push({y: e.entries[0].dataPoint.pie1});
        pieChart.options.data[0].dataPoints.push({y: e.entries[0].dataPoint.pie2});
        pieChart.options.data[0].dataPoints.push({y: e.entries[0].dataPoint.pie3});
        pieChart.render();
      },
      contentFormatter: function() {
        return "<div id='pie-chart' style='width:200px; height:200px;'></div>";
      },
      hidden: function() {
        typeof pieChart.destroy === "function" && pieChart.destroy();
      }
    }
.
.
 dataPoints: [
        { y: 219960, name: "First", pie1: 20, pie2: 30, pie3: 50},
        { y: 363040, name: "Second", pie1: 60, pie2: 20, pie3: 40}
      ]
.
.
Please take a look at this JSFiddle for complete working code.
—-
Manoj Mohan
Team CanvasJS