Login to Ask a Question or Reply
Home › Forums › Chart Support › Scrollbar to chart canvas is increasing as tooltip height increases › Reply To: Scrollbar to chart canvas is increasing as tooltip height increases
September 10, 2021 at 4:58 pm
#35688
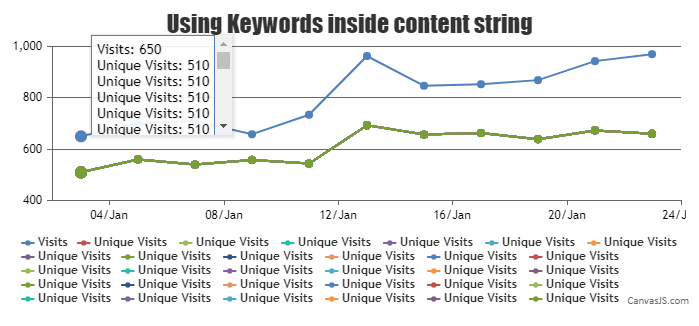
It is possible to use a scrollbar when there are multiple dataSeries needed to be shown on the toolTip. You can do so by changing overflow-y, height and pointer-events CSS properties of ‘canvasjs-chart-tooltip’ class as shown in the code-snippet below,
.canvasjs-chart-tooltip{
  height: 100px !important;
  overflow-y: scroll !important;
  pointer-events: auto !important;
}
Kindly take a look at this updated JSFiddle for an example on scrollable toolTip.
—
Adithya Menon
Team CanvasJS