Login to Ask a Question or Reply
Home › Forums › Chart Support › Chart within ToolTip or Chart within a Chart › Reply To: Chart within ToolTip or Chart within a Chart
September 9, 2021 at 8:41 pm
#35670
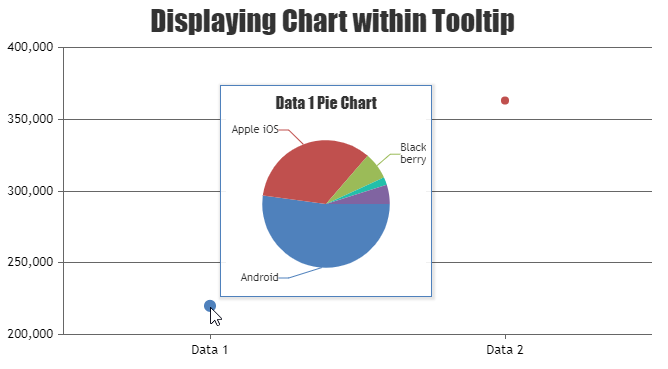
To display a chart inside tooltip, you can create a DOM required for the chart within tooltip using contentFormatter and render the chart on updated event of toolTip. Please take a look at this below code snippet for the same.
toolTip: {
      updated: function(e) {
        typeof pieChart.destroy === "function" && pieChart.destroy();
        pieChart = new CanvasJS.Chart('pie-chart', chartOptions[e.entries[0].dataPoint.label]);
        pieChart.render();
      },
      contentFormatter: function() {
        return "<div id='pie-chart' style='width:200px; height:200px;'></div>";
      },
}
Also, check out this JSFiddle for complete sample code for rendering the chart within tooltip.
—-
Manoj Mohan
Team CanvasJS