Login to Ask a Question or Reply
Home › Forums › Chart Support › How to update values in line chart from MySQL DB › Reply To: How to update values in line chart from MySQL DB
August 2, 2021 at 6:59 pm
#35000
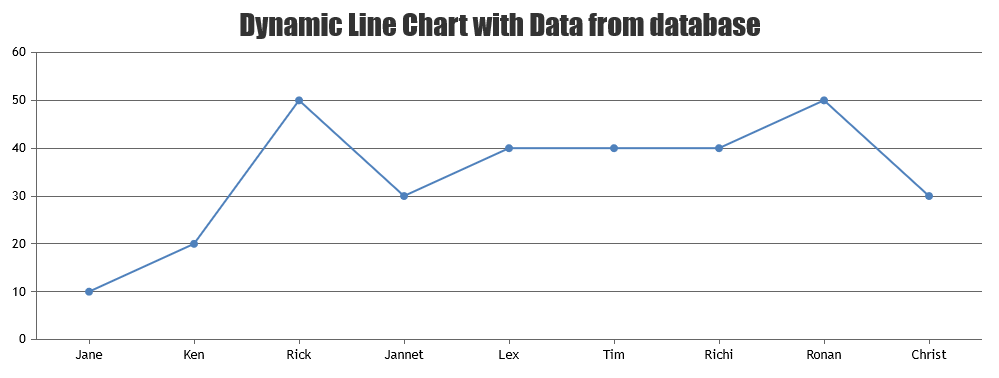
CanvasJS supports multi-series charts as demonstrated in the previously shared sample. In order to render just one line (single dataseries), you need to pass just one dataseries in the chart-options as shown below.
$.each((data), function(key, value){
	chart.options.data[0].dataPoints.push({label: value[0], y: parseInt(value[1])});
});
Please take a look at this updated sample project for working code. Also refer to PHP Gallery for more set of examples along with source-code.
If you are still facing issue, can you kindly share sample project over Google-Drive or Onedrive along with sample database and brief us further so that we can understand your issue better & help you out?
—
Vishwas R
Team CanvasJS