Login to Ask a Question or Reply
Home › Forums › Chart Support › Line Chart Connector Colors › Reply To: Line Chart Connector Colors
July 16, 2021 at 4:22 am
#34870
Can you please provide some sample data so that we can understand your scenario better and help you out?
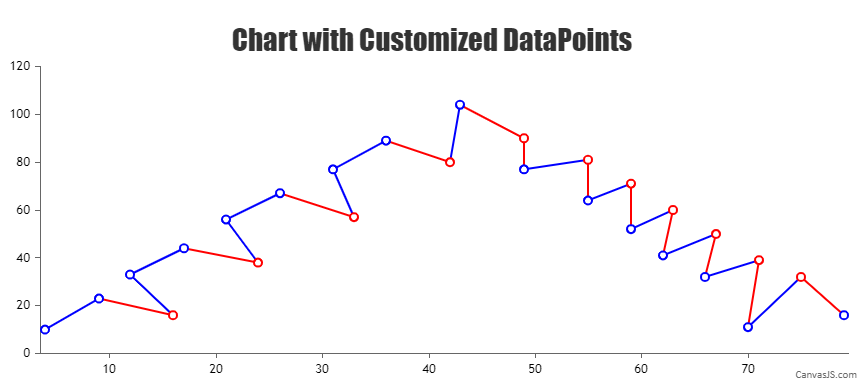
Based on the screenshot shared, you can easily achieve the requirement by setting the markerBorderThickness, markerColor, markerBorderColor, and lineColor as shown in the code snippet below –
{
    type: "line",
    markerBorderThickness: 2,
    markerColor: "white",
    dataPoints: [
      {x: 4, y: 10, markerBorderColor: "blue", lineColor: "blue"},
      {x: 9, y: 23, markerBorderColor: "blue", lineColor: "red"},
      {x: 16, y: 16, markerBorderColor: "red", lineColor: "blue"},
      {x: 12, y: 33, markerBorderColor: "blue", lineColor: "blue"},
      {x: 17, y: 44, markerBorderColor: "blue", lineColor: "red"}
    ]
}
Also, please take a look at this JSFiddle for an example on same.
___________
Indranil Deo
Team CanvasJS